
A Look at Three Significant Mobile eCommerce Trends
Over the last few years, a lot has been written about the rise of mobile and tablet devices, and the relative decline of the desktop.
You may already know that mobile internet usage is increasing fast, but that doesn’t necessarily mean it’s more important for your business. Taking a closer look at some common statistics reveals some interesting things about eCommerce. We looked at the data, and the results may surprise you.
A significant tipping point occurred in January 2014, when, for the first time, mobile internet users exceeded desktop internet users. However, this shift was primarily driven by app usage, with mobile internet browsing still lagging significantly behind desktop browsing.
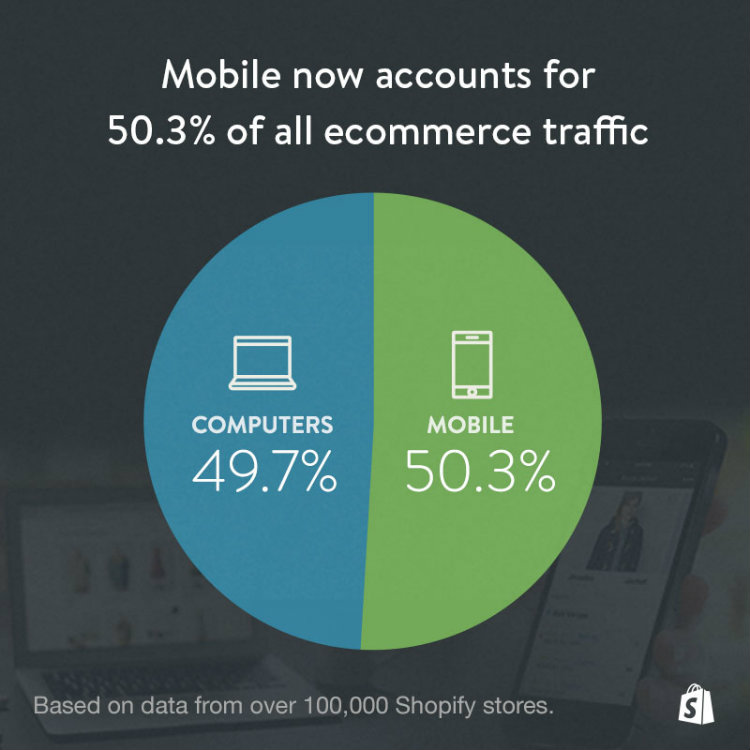
In August 2014, an even more monumental event happened: mobile eCommerce traffic exceeded desktop eCommerce traffic for the first time, as confirmed by research conducted by Shopify. According to their results, 50.3% of traffic came from mobile devices — approximately 80% of this figure consisted of smartphone users, with the remaining 20% consisting of tablet users.
This is an excellent demonstration of the public’s changing attitudes towards the mobile internet, and more specifically, mobile commerce.
However, top level statistics don’t always tell the full story and can even be downright misleading. To avoid confusion, I want to take a closer look at three of the most significant mobile trends occurring right now. I’ll also be exploring how the three trends impact you and your business.
Most Users Still Buy from Desktops
Despite a growing number of mobile and tablet users, eCommerce conversion rates on these devices still lag way behind desktop users.
According to Statista, 3.41% of desktop visitors result in a conversion in 2014. This drops to 2.86% for larger tablet devices, and then a substantial drop to 0.92% for smartphones. Interestingly, the conversion rate for iOS devices was almost 60% higher than for Android devices – 2.07% versus 1.21%.

Multi-channel testing company, Monetate, analyze these conversion rates every quarter, and although the numbers fluctuate, the conversion rates are relatively stable in relation to each other. For example, their latest report, Q2 2015, confirmed this trend, with conversion rates of 3.65% for desktops, 3.22% for tablets, and 1.16% for smartphones. Again, iOS smartphones (iPhones) outperformed Android smartphones, and iOS tablets (iPads) outperformed Android tablets.
Want more? In Google’s Mobile Path to Purchase study, researchers found that consumers were least likely to make a purchase from their mobile devices – only 17%. On desktop/tablet devices, 45% of consumers made a purchase. However, the runaway winner was in-store purchases, with a whopping 82% — more on this later!
Key Takeaways:
- If you want to increase mobile sales, reduce as many barriers to sales as possible. The size of the mobile device is one of the main obstacles; this means easy navigation, a clean UI, and a streamlined checkout is a must.
- Embrace this consumer behavior – make it easy for mobile users to save their shopping session so they can return to it on a desktop at a later date.
Mobile Devices are Used for Research, Not Purchasing
This data supports a popular hypothesis: that shoppers are more inclined to research on their mobile devices, before buying from their desktop.
There are many possible reasons for this:
- People use their mobile devices on the go, and so it’s not always practical for them to make a purchase.
- People trust their mobile device’s security less than their desktop. Monetate’s quarterly research shows that consumers are likely to trust their desktop more for larger purchases, too — the average mobile spend is only 72% of the value of the average desktop spend; for tablets, it’s 86%.
- Mobile websites often have inferior UI compared to desktop.
- Smaller screen sizes make it more awkward to buy on mobile devices.
- Mobile research is more likely to result in an “in person” purchase than desktop research, which skews the conversion rate statistics.
With more visitors but low conversions, the data does appear to back up the research hypothesis. And again, when you think in practical terms about how people are using their mobile device, this makes a lot of sense.
- We casually browse products online for fun.
- When faced with buying a product in a store, we hop online to check out the reviews.
- When faced with buying a product in a store, we check competitors’ prices to find the low-cost option.
It’s little surprise that mobile has become the device of choice for product research, really.
In 2013, Google attempted to back up this hypothesis with real world, quantitative data. They found that the average consumer spends 15 hours per week on mobile research – research time was split roughly 52%/48% between the mobile web and apps.
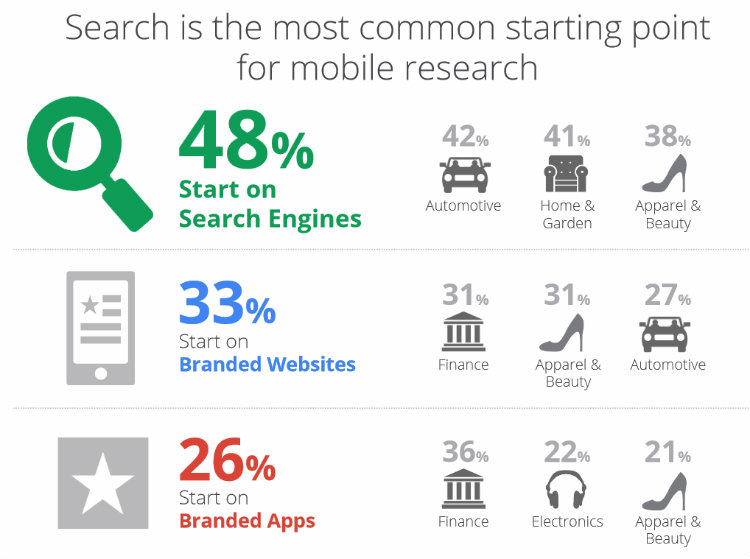
For those of you interested in how people use their mobile devices for research, Google’s study found that 48% start on the search engines, 33% start on branded websites, and 26% start on branded apps. In total, 74% used the search engines at some point during the researching process.
Key Takeaways:
- Don’t ignore mobile; even if the conversion is happening via different channels, the buying process often begins with mobile.
- Cross-channel tracking allows you to understand the true value of your mobile traffic.
- If mobile visitors are primarily using your website for research give them all the information they need – product details, images, prices, reviews – to help them make a decision.
Mobile is King for Local Businesses
Perhaps the most interesting trend is the role mobile research plays in “in person” conversions from local businesses – as we’ve already mentioned, Google found that 82% of us purchase in-store.
As always, this is primarily a matter of logistics – we spend most of our time out and about, so we inevitably make more purchases in store. And, when we need something at short notice, we’re most likely to turn to our mobile devices for research as a matter of convenience and practicality.
An example of this would be someone who is looking for a coffee shop when running errands. To get a caffeine hit, this person is more likely to pull out a mobile device and search for local coffee houses than a laptop, right?
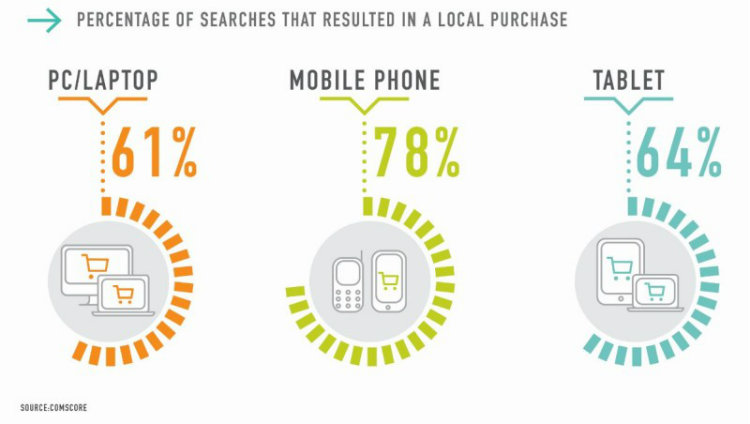
According to research by SEL, this behavior makes mobile traffic the most valuable market segment for local businesses. Their research showed that 78% of mobile devices resulted in an in-store purchase, compared with 64% for tablets and 61% for desktops.
Key Takeaways:
- If you run a local business, understand that most mobile research is performed with the intention to buy quickly – 55% within an hour, 83% on the day. Make it easy for visitors to call to get in touch with you or find your store’s location from your mobile site or app.
- Because mobile traffic drives more business than desktop traffic, local businesses will see a larger ROI by targeting mobile traffic with their PPC campaigns.
- If your target audience is performing non-branded searches, make local search a priority for your SEO strategy.
Final Thoughts
I hope this post gives you a better understanding of online consumers’ attitudes towards mobile commerce.
At present, all trends point towards mobile internet use being on the rise, with desktops dropping in relative terms. Few things stand still in the online world, so it pays for you to stay on top of all the latest trends in your industry.
Where do you think mobile commerce is headed? Share your thoughts in the comments section below!