
Get to Know Your Mobile Visitors with Google Analytics
Analytics help us make decisions that grow our company.
With an analytics tool, we can look at page views, conversion rates, bounce rates, and more. We can see where our site is leaking visitors and conversions, and try to patch those leaks to increase our revenue.
You are probably already doing this with a tool like Google Analytics, Woopra, Kissmetrics, or Mixpanel. What I want to know is if you’ve ever segmented your mobile web users and analyzed what they are doing? Looking at a visitor who comes to your site on a mobile phone or other small device separately may lead to some interesting insights that can help you improve engagement–and end up increasing your sales.
Let’s take a look at some interesting mobile stats and see how we can apply this knowledge to our businesses.
Mobile Stats on the Web
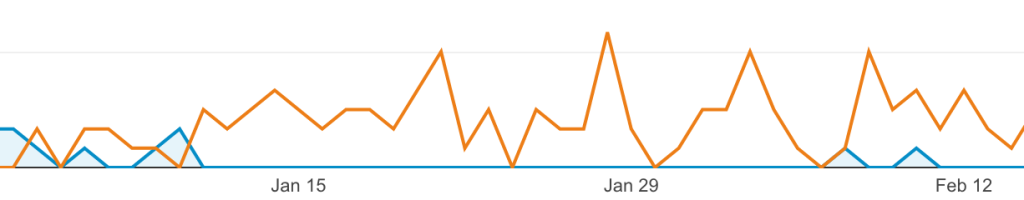
You may already know that mobile internet usage has surpassed desktop; many websites see near 50% of their users visit on mobile, including Google and Amazon. That is according to Clickz data from 2014, and I would wager that mobile usage is much higher in 2016.
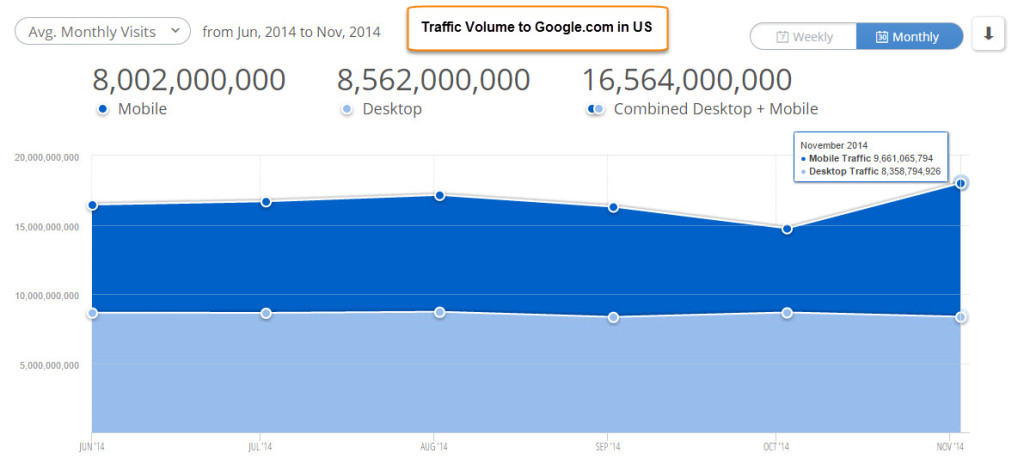
Photo: Clickz
That same data shows that visits are shorter, and bounce rates are higher on mobile, but not across the board. For example, on Google:
Visits from desktop lasted more than three times longer, with more than three times more pages viewed and two times lower bounce rate.
It’s not just Google, though! Entertainment site IFC and the site for Chili’s, a popular restaurant chain, actually saw better engagement on mobile:
Longer visits, more page views, and slightly higher bounce rate add up to an amazing result and one of the best adaptations to the mobile world.
The better engagement rate could be due to great responsive design, along with the nature of the content. People use the internet differently on mobile, which is why it’s important to segment and optimize. By looking at this data, we can find out what people are doing on mobile, and increase our own mobile engagement.
Segmenting for Mobile with Google Analytics
Your mobile site usage will be different than Google, so it’s important to dig into your own analytics. Let’s look at how to segment and analyze your data in Google Analytics.
How many mobile visitors do we have?

Most tools have a way to segment your mobile visitors.
I’m going to focus on Google Analytics, as it’s one of the most common First, log into your account and go to Reporting => Audience => Overview.
Next, click where it says “All Users” or “Add Segment” towards the top of the page. This will show you all of your available segments, you can choose “Mobile Traffic.”
You can uncheck “All Traffic” to see mobile only, or leave it checked for a comparison. Click the blue “Apply” button underneath the segments, and now you will see your new segmented data.
You should now be able to see the percentage of mobile only traffic to your site, and you can click into other navigation items to see other data.

By using this method, I found that over 30% of our visitors are using a mobile device. Depending on the category of your business, you may find that your percentage is higher or lower than that. This is a metric you should document! If you release a new website design and that number drops, you may need to invest in some responsive design improvements; you can use this data as qualitative feedback that can be used to keep reeling your customers in.
You can check device types under Audience => Mobile => Devices. Globally, Android devices are much more prevalent at about 80% market share. However, statistics show that iOS users spend more money, so iOS traffic could be more beneficial.
You can dive deeper into your audience analytics and find other great insights as well and find out all kinds of good information that can help you figure out where people are coming from, and why they’re staying (or leaving).
Where are mobile users coming from?
With your mobile segment still active, click on Acquisition => Overview.
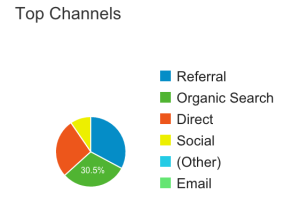
This will show you where your mobile visitors are coming from.
You can view lots of different things in this section, an interesting one is if you click Social => Overview. Here you can see your top social interactions, such as links clicked through Facebook and Twitter. We are the most active on Twitter, but our #1 social metric is from Facebook. We are running some Facebook ads, so I think that is skewing the results, but I can see how many clicks I get from my shared articles.
Using this data, you can see if the time you put into social media is paying off, or if you need to change your strategy.
What pages are mobile visitors viewing?
Go to Behavior => Site Content => All Pages to see your most visited pages on mobile.
This can give you great insight into what pages to focus on when optimizing your design for mobile. For example, our most popular mobile page is our pricing page. Comparing that to desktop, our most popular page is the homepage. My hypothesis is that people are researching our prices on mobile, which tells me I should improve our responsive design on that page.
By adding a more responsive pricing table, I can help people get the information they need faster, which could lead to more sales.
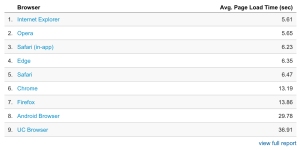
Another metric worth looking at under “Behavior” is the site speed overview. This will show you average page load times, and you can even get suggestions on how to improve speed. I was surprised to see some pages averaging over ten seconds in load time on mobile, which means I definitely have some work to do there! This could be due to traffic from devices on slow 3G connections, perhaps from other countries. It’s important to remember that not everyone has LTE and fast wifi connections all the time like we are used to in the US.
Site speed is a huge determining factor of mobile bounce rates, increasing speed should lead to more time spent on my site.
When it comes to mobile purchases…
If you have setup conversions in Google Analytics, you can also get data on how many people purchase from a device. (If you haven’t, learn how to setup a conversion funnel here)
With my conversion funnel setup, I can go to Conversions => Goals => Overview and see my stats. I see that only 8% of my sales are through a mobile device, and my conversion rate is five times higher on desktop.
It’s common for purchases and conversion rates to be lower on mobile for many businesses. Filling out a form on your phone sucks, and often times we are on the go when using our devices. I have no doubt that we can improve these metrics with some simple updates to our checkout process, and large Ecommerce stores could see big gains with an investment in this area.
Most sites do not provide a smooth purchasing experience on mobile, this is an area that is ripe for innovation.
Start using mobile analytics today!
Analytics help us make key decisions about our businesses, and it’s important to not use a shotgun approach. Segmenting our mobile data is an important way to refine our decision making process.
We covered Google Analytics in this article, but event based analytics software like Woopra and Mixpanel can help you dive deeper. These tools allow you to track button clicks, form signups, and other specific conversion events on desktop and mobile.
The most important thing is to dig into your mobile analytics, no matter how you’re doing it, and make sure you know what is going on with your mobile visitors. If you don’t know what they are doing, you may miss some low hanging fruit that can improve your engagement and revenue.
Great hammer of Thor, that is poflwruely helpful!
As someone who uses GA extensively a very useful tip. Mobile data is crucial these days. Many thanks.
Glad you found it useful!
Scott, here are some more mobile analytics that seem to be right on with your numbers. http://blizzardmetrics.com/mobile-benchmark-master-list/